21st Annual Study of Logistics and Transportation:Partnerships add value to the Masters of Logistics
Latest Logistics News
LM Podcast Series: Assessing the freight transportation and logistics markets with Tom Nightingale, AFS Logistics Investor expectations continue to influence supply chain decision-making Under-21 driver pilot program a bust with fleets as FMCSA seeks changes Diesel back over $4 a gallon; Mideast tensions, other worries cited Four U.S. railroads file challenges against FRA’s two-person crew mandate, says report More NewsThey’re at it again. Over the past two decades of conducting this study, we have often found that it’s the Masters of Logistics—those with sales greater than $3 billion—who are the first to implement new transportation management methods and approaches, put new technology to use, or move more quickly than smaller organizations to integrate internal systems.
However, in the past few years, the competitive gap that was created by the Masters through these actions essentially closed—in other words, there wasn’t a statistically significant difference between small-, medium-, or large-sized companies. During that time, being the “biggest” simply didn’t translate into being the “best” in terms of logistics and transportation practice.
The results of this year’s study suggest that the Masters are again taking the lead when it comes to creating value through the delivery of differentiated service; in fact, we found that the Masters think differently when it comes to actualizing this concept as they view their people and processes as key elements in differentiating their organization in the marketplace.
That is to say, the Masters perceive that they are better than their competition in terms of delivering service that distinguishes between customer groups at a lower total cost.
This year’s results indicate that the Masters clearly believe that rewarding performance of logistics and supply chain personnel results in exceptional customer service that sets them apart from competitors. Further, the Masters strongly agree that innovation in logistics and transportation services improves their competitive position.

But this is a just one element of what we learned while dissecting the results of this year’s study. Some 1,370 domestic and global logistics, transportation, and supply chain management professionals participated in the study (a near record turnout), offering insights on trends and issues relevant to today’s busy managers.
In addition to the University of Tennessee, the research was conducted in partnership with Con-way Inc., Ernst & Young, and Logistics Management. Participants accounted for an estimated $30.1 billion in domestic transportation expenditures and over $20.5 billion in international transportation. The Masters of Logistics represented 27.8 percent of the study participants. Medium-sized firms, with between $500 million and $3 billion in annual revenue, were 20.6 percent of respondents. The majority of respondents (51.6 percent) were smaller firms with reported annual revenue less than $500 million.
Respondent companies represent a broad and diverse set of fifteen industry sectors ranging from pharmaceuticals to food. Since the beginning of the study, the core group of participants has been in the manufacturing sector—this year they made up 42.6 percent of the total. Consumer products companies represent the largest sub-sector of that group at 15
percent.
The results identify the emergence of an idea advocated for over a decade, and one which is being put into place by the Masters of Logistics: Use logistics and transportation services to differentiate yourself in the marketplace. As one would suspect, being able to deliver differentiated service is not possible without a value-creating partnership between the shipper and its strategic carriers; in turn, this has created a unique balance of power between the two parties.
Setting the baseline
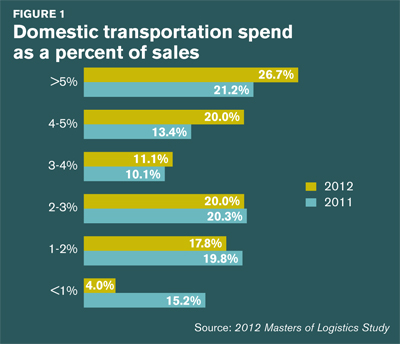
Overall transportation spending as a percent of sales increased from 2011 to 2012. The data in Figure 1 on page 36 shows that companies who spent more than 5 percent of sales on domestic transportation increased year-over-year, rising from 21.2 percent to 26.7 percent in 2012.
Respondents reporting transportation spending greater that 3 percent of sales increased from 44.7 percent in 2011 to 47.8 percent this year. These increases occurred at a time when many in the profession considered the supply and demand for transportation to be somewhat balanced.
The increases in transportation spend, however, are not equally reflected across companies relative to size. The Masters’ domestic transportation spend as a percent of sales for 2012 was 2 percent to 3 percent on average—a decline from 2011 when it was 3 percent to 4 percent. Both small- and medium-sized companies reported increases in 2012, while the majority spent more than 4 percent of sales for transportation services. This is contrasted to 2011 when most small firms spent less than 3 percent of sales on this activity and medium-sized companies spent between 3 percent to 4 percent on average.
Why the change? One indicator is the change in strategic direction for many companies. Following several years of intense cost cutting, particularly in transportation spending, the 2012 study results point towards companies shifting some of their focus to maximizing profitability and asset utilization.
In the meantime, the percentage of respondents who reported that their primary objective is reducing costs has shrunk each of the past three years—findings that reveal that shippers again believe that you have to spend money to make money.
Transportation is critical in value creation
Being able to rapidly respond to changing customer requirements is becoming increasingly critical for both shippers and carriers. Today, more than ever, transportation plays a key role in helping companies attain that necessary level of responsiveness.
Our study indicates that some 71.6 percent of respondents are either capable or highly capable of adjusting transportation operations in response to changing conditions—and this ability to alter and adapt is greater for transportation than for logistics operations.
According to Tony Ross, Ernst & Young’s senior manager of advisory services, transportation costs as part of cost-to-serve have not been identified to the level necessary to identify the value being created. “But as we get more granular by using ‘total delivered cost’ as the value creation metric, we can measure the cost and value in not only our ability to be adaptive and responsive, but understand if those actions were the right ones to meet customer service requirements and profit margins,” says Ross.
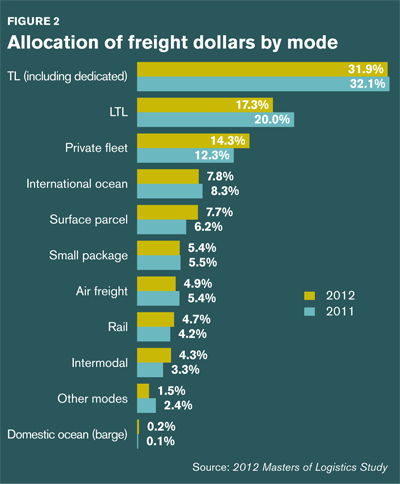
The need to create more value is reflected in how shippers are utilizing the various modal combinations. As shown in Figure 2, truckload (TL) still accounts for the largest share of the transportation budget. In addition to being highly responsive to changing conditions, TL enables companies to address concerns about fuel costs that ultimately impact the cost to serve and the total landed cost.
LTL accounted for 17.3 percent of the transportation budget in 2012, representing the second largest modal expenditure for firms. However, this is a decline of 2.7 percentage points from 2011. The decline in LTL was the largest change reported for any of the modes for 2012. We found that part of this decline in spending was used to boost the budget for private fleet. After a slight dip in the percent of the transportation budget in 2011, the expenditures for private fleets are almost on par with the 2010 level.
The decline in LTL was the largest change—both positive and negative—reported for any of the modes for 2012. Rail’s portion of the transportation budget remained essentially the same year-over-year while intermodal increased in 2012 accounting for 4.3 percent of total spend. In general the budget is allocated among several key modes of transportation.
“In today’s environment, shippers and manufacturers are looking to the multimodal strategy, as there is some concern about the balance of supply and demand in the transportation space,” says Tommy Barnes, president of Con-way Multimodal. “Companies, both shippers and carriers, are looking for a way to use the right capacity in the right geographical places. Using a multimodal strategy can fill that gap.”
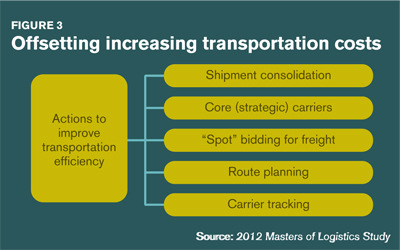
What are shippers doing to increase the value mix? As shown in Figure 3, the top five initiatives are ones that have appeared on this list
consistently over the past few years. Of the leading actions being utilized to increase the value mix, perhaps the most promising one is the use of core or strategic carriers.
To be successful, both shippers and carriers must be fully committed to the relationship. The list of the top five initiatives also reveals that there aren’t a lot of new actions being taken to stretch the transportation dollar.
Several actions that were ranked below these top five are a mix of operations, tactics, and strategy and include items such as: differential customer service levels; intermodal shipments; use of dedicated transportation; and load planning. The efficiency initiatives suggest that shippers are making use of multiple methods to keep transportation costs in check.
“Logistics and transportation efficiencies will help create a competitive advantage for small- and large-sized shippers,” says Barnes. “The efficiencies can drive logistics and transportation productivity and eliminate risk, thus allowing organizations to focus on customer/supplier value.”
Changing the power equation
Many factors have caused shippers to change the way they manage logistics and supply chain activities. The main influences according to the results from this year’s study are:
ability to respond to changing customer requirements;
energy (fuel) prices;
cost to serve (specifically distribution);
inventory reduction; and
- total landed costs.
The results of this year’s study suggest that the nature of the relationship between carriers and shippers has fundamentally shifted. Over the years, academics and practitioners alike have advocated a balance of power as the means to achieve better performance for both factions.
The question of interest has been whether and under what conditions the competitive behavior of both groups would lead to some sort of equilibrium. By all indications that time has arrived.
Study participants are in strong agreement that being better than their competitors in terms of service would significantly improve their competitive position. There is also an awareness that while logistics and transportation service will differentiate them in the marketplace, it does not allow them to charge customers a premium price—hence the need for carriers and shippers to work together to create the former without incurring the latter.
Many of the Masters are spearheading the move to deliver value-creating service that distinguishes them in the marketplace. “Within the Masters, those that are the leaders are leveraging the best tools possible on a daily, weekly, monthly, quarterly, and annual basis,” says Ross. “This means doing a transportation procurement assessment and using collaborative optimization at least annually. It means reviewing the optimal ‘ship from’ locations bi-annually. It means analyzing asset allocation to be the best locations for maximum utilization, in addition to the regular route/lane optimization and capacity analysis. Finally, it means every mile needs to be examined for value—do not leave money in the back of the trailer.”
Mixed performance results
The data presented in Table 1 show that TL and LTL reported basically the same performance relative to on-time delivery. The likeness ends there, however, as TL performed better on percent of correct invoices and damage as compared to LTL.
With an 89.2 percent on-time delivery record, rail has the worst performance of the seven modes reporting this statistic. (See Table 2 for air freight and ocean.) While performance for this metric improved from the previous year, it still lags significantly behind the other modes. Intermodal also reveals one its areas of weakness, as its on-time performance trails TL and LTL.
Compared to the 2011 performance data, some significant changes have occurred—most of which are positive. For LTL and rail, on-time delivery substantially improved from 2011 to 2012. These same modes also posted meaningful increases in performance for correct invoices and damage.
In a business environment where eliminating waste is a key initiative, the decline in the rate of damage for freight is an appreciated outcome. On the negative side, on-time delivery for TL declined year-over-year. In 2011, TL on-time performance was 95.9 percent. As Table 1 indicates that metric fell to 93.9 percent for 2012.
The same mixed results were also reported for the international transportation modes. On-time delivery for ocean was in the same range as intermodal, while air freight’s performance was similar to trucking.
Of particular interest was the percent of correct invoices for air freight. This metric was significantly lower than any of the other modes, and it represented a major decline in performance from the previous year. Ocean, on the other hand, turned in a substantial improvement in performance for correct invoice and damage for 2012 as compared to last year.
Getting performance to the required level is the basic foundation upon which differentiated service is built. Without the ability to perform as required differentiated service will lose either some, or all, of its value. Coupled with this is the need to provide that service based on strategy and market segmentation—this is a fundamental key to delivering service at the “right price.”
Two primary observations can be made regarding the data in Table 3. First, the absolute difference in performance between best and average customers is fairly low. Namely the level of service a best customer receives compared to an average customer is not significant.
The small gap represents an opportunity for delivering differentiated service, which in turn could possibly result in cost savings as the “right” service levels are provided to the best and average customers. Second, the difference between best and average customers has remained relatively unchanged, with the one exception of over/short/damage where respondents have reported dramatic improvements over the past three years.
What are the Masters doing? Interestingly, except for on-time delivery, the gap between best and average customers is greater for the Masters compared to all of the respondents. In this case, differentiated service is being realized.
Putting value in the driver’s seat
The study results show an emerging trend by the Masters of Logistics to set themselves apart from their competitors through differentiated service. Transportation plays a critical role in enabling the firm to deliver differentiated service of which a prominent feature is being able to respond to changing condition. As such, it positions transportation as a vital part of value creation.
Findings from the study also indicate that logistics is less capable of adapting and altering in response to changing supply and demand conditions. While other factors have certainly affected the relationship between carriers and shippers, it is irrefutable that the value created through differentiated service is a driver in moving these two groups towards a different type of association.
The balance of power that currently exists between carriers and shippers—primarily the Masters of Logistics—defines this as a unique time. However questions remain to be answered: Will other companies follow the lead of the Masters? And if so, will the balance of power be a lasting change?

Article Topics
Latest in Logistics
LM Podcast Series: Assessing the freight transportation and logistics markets with Tom Nightingale, AFS Logistics Investor expectations continue to influence supply chain decision-making The Next Big Steps in Supply Chain Digitalization Under-21 driver pilot program a bust with fleets as FMCSA seeks changes Diesel back over $4 a gallon; Mideast tensions, other worries cited Four U.S. railroads file challenges against FRA’s two-person crew mandate, says report XPO opens up three new services acquired through auction of Yellow’s properties and assets More LogisticsAbout the Author
Subscribe to Logistics Management Magazine

Find out what the world's most innovative companies are doing to improve productivity in their plants and distribution centers.
Start your FREE subscription today.
April 2023 Logistics Management

Latest Resources


