Top 30 U.S. Ports 2020: Responding to the Pandemic
Last year at this time trade tensions were largely determining where cargo would go next—now it appears that those will be regarded as “the good old days.” To what extent container volumes will rebound across the board is subject to much speculation.

When the American Association of Port Authorities (AAPA) staged its 5th annual “Ports Day” last month, participating members were hoping to raise public consciousness of the vital role they play in the nation’s economy.
Port authorities wanted the shipping public to know that investment in dredging and infrastructure was continuing to ramp up on all coasts in anticipation of more mega-vessel calls. Platforms for digitization and related technologies were also being installed, along with new recruitment plans for a new generation of highly skilled workers.
This time, however, the common issue of the COVID-19 pandemic prevailed over all others.
AAPA president and CEO, Chris Connor notes that prior to this global emergency, the domestic maritime industry employed more than 642,000 full time dockside workers, all of whom are dedicated to “flattening the curve” of the virus. Today, many of those jobs are in jeopardy as terminal operations have slowed and cargo throughput is not likely to measure up to even last year’s disappointing numbers.
According to IHS Markit’s Global Trade Atlas (GTA) Forecasting, combined international sea trade moving through Western Hemisphere seaports in 2019 totaled nearly 4.2 billion metric tons in volume and $3.7 trillion in value. Of that combined total, seaports in Central and South America handled 1.86 billion metric tons of cargo valued at $1.17 trillion, while North American seaports handled 2.34 billion metric tons of goods, valued at $2.53 trillion.
|
2019 Rank | Port | TEUs | % of Total | % of Change | 5 year CAGR | TEUs | Rank |
1 | 4,872,906 | 16.9% | -3.3% | 0.7% | 5,039,363 | 1 | |
2 | 4,256,331 | 14.8% | 1.4% | 5.6% | 4,196,372 | 3 | |
3 | 3,972,104 | 13.8% | -9.0% | 0.9% | 4,364,771 | 2 | |
4 | 2,350,708 | 8.2% | 5.7% | 8.2% | 2,223,628 | 4 | |
5 | 1,952,504 | 6.8% | 7.8% | 6.0% | 1,811,737 | 5 | |
6 | 1,479,165 | 5.1% | -5.7% | 4.0% | 1,567,803 | 6 | |
7 | 1,354,209 | 4.7% | 11.2% | -4.0% | 1,217,316 | 8 | |
8 | 1,340,087 | 4.7% | 2.1% | 4.2% | 1,312,476 | 7 | |
9 | 1,213,734 | 4.2% | 0.3% | 5.1% | 1,210,214 | 9 | |
10 | 1,096,646 | 3.8% | 2.4% | 2.1% | 1,070,642 | 10 | |
11 | 842,725 | 2.9% | 12.2% | 10.2% | 750,801 | 11 | |
12 | 554,159 | 1.9% | -23.9% | -3.9% | 728,461 | 12 | |
13 | 520,288 | 1.8% | 2.3% | 7.8% | 508,802 | 14 | |
14 | 466,296 | 1.6% | -11.4% | 16.6% | 526,056 | 13 | |
15 | 376,365 | 1.3% | 9.2% | 10.5% | 344,697 | 15 | |
16 | 297,228 | 1.0% | -12.2% | 2.2% | 338,527 | 16 | |
17 | 262,675 | 0.9% | -1.3% | 2.6% | 266,226 | 17 | |
18 | 225,113 | 0.8% | 29.1% | 11.5% | 174,430 | 19 | |
19 | 207,281 | 0.7% | 5.2% | 3.0% | 196,994 | 18 | |
20 | 168,599 | 0.6% | 3.9% | 8.4% | 162,221 | 20 | |
21 | 152,326 | 0.5% | -5.5% | 1.8% | 161,183 | 21 | |
22 | 134,670 | 0.5% | 7.0% | 2.8% | 125,863 | 22 | |
23 | 112,182 | 0.4% | 11.1% | 13.5% | 101,010 | 23 | |
24 | 94,202 | 0.3% | -6.0% | -0.5% | 100,189 | 24 | |
25 | 72,087 | 0.3% | 4.4% | 6.0% | 69,067 | 25 | |
26 | 62,938 | 0.2% | -7.6% | 5.1% | 68,098 | 26 | |
27 | 62,648 | 0.2% | 24.2% | 19.1% | 50,450 | 27 | |
28 | 53,258 | 0.2% | 12.8% | 5.5% | 47,217 | 28 | |
29 | 30,505 | 0.1% | -9.6% | -1.3% | 33,726 | 30 | |
30 | 29,179 | 0.1% | -22.1% | 2.3% | 37,449 | 29 | |
National | 28,939,514 | -0.6% | 3.3% | 28,939,514 | |||
And with a day-to-day focus on the impact of COVID-19 on seaport operations, it’s easy to lose track of longer-term trends, notes the global trade intelligence firm Panjiva.
“Looking through the lens of inbound traffic, we can see that 2019 was the first year since 2009 that there was a year-over-year dip in U.S. seaborne imports, albeit at a modest rate of 0.9%, back-end loaded into the fourth quarter,” observes Panjiva research director, Chris Rogers.
According to Panjiva’s most recent report, the slowdown was largely due to a 6.3% slide in imports from China resulting from the U.S.-China trade war. The increase in tariff rates in May and wider range of products covered in September meant the downturn accelerated through the year. Imports from other Asian countries—particularly Vietnam and Taiwan—partly offset the decline as importers sought to switch their supplies to lower cost countries.
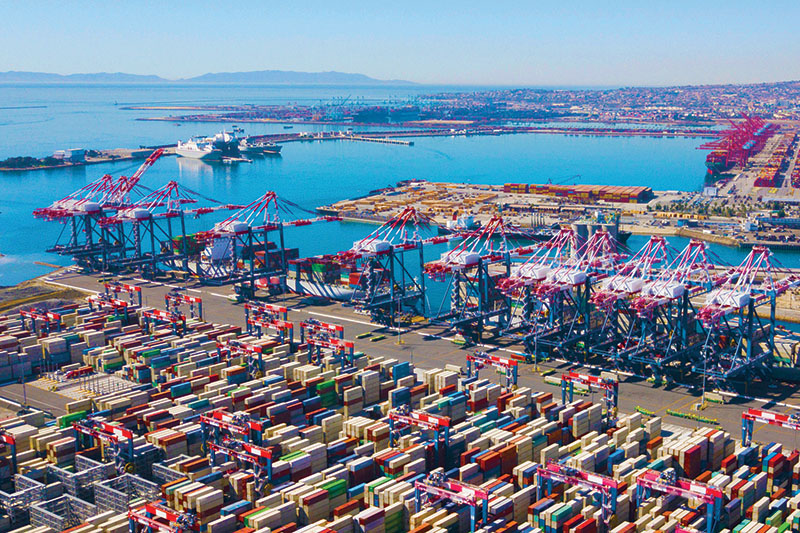
“Given that the downturn in imports was led by Asian supplies, it’s perhaps unsurprising that the West Coast ports fared worse than average with imports to Los Angeles down by 3.3% and those to Long Beach falling by 9.0% in 2019 versus 2018. The outlier was Tacoma, which saw an 11.7% surge after lease-related disruptions in 2018 led to lower shipments that year,” notes Rogers.
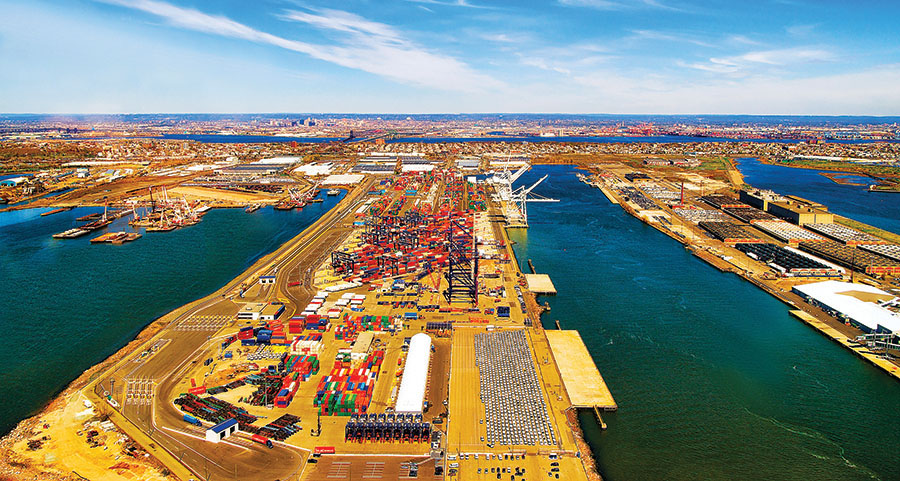
Meanwhile, the strength in shipments from the rest of the world helped the ports of Newark and New York increase by 1.4% to reach second place ahead of Long Beach for the first time. The raising of the Bayonne Bridge to allow larger vessels to access the port also helped. Capacity increases also helped Houston and Savannah improve upon last year’s performances with increases of 6.8% and 8.2% respectively.
“The only other major switch in position in the Top 30 rankings was between Baltimore and Philadelphia,” adds Rogers. “Baltimore saw volumes rise 2.3% to take 13th place from Philadelphia which fell by 11.4%.”
Planning challenge
Planning for the future will be another new challenge for both port operators and global shippers, say analysts for Fitch Ratings.
The pandemic is having wide-ranging effects on port space, both through disruptions to supply chains emanating from the first rounds of infection in Asia and government-imposed restrictions on individuals, businesses and corporations alike—the former directly affects cargo port volumes, while the latter affects the broader consumer demand that drives imports and exports.
Furthermore, the economic effects of the pandemic are expected to generate throughput and cargo declines along with financial stresses well in excess of what Fitch expects under typical recessionary conditions. In Fitch’s view, credits with high concentrations of cargo trade with Asian markets will initially see the most acute effects to volumes and revenues, with some relief expected as the pandemic dies down in Asia and volumes rebound with factories coming back online and blank sailings reducing.
However, for the balance of 2020, and particularly in North America and Europe, cargo shipping is increasingly likely to face ongoing economic developments similar to the global financial crises 10 years ago, pressuring volumes and revenues on into 2021.
Bar pilots faced with multitude of challenges
The San Francisco Bay Area has proven to be amazingly resilient in the face of the COVID-19 epidemic, with civic leaders and logistics managers anticipating the crisis while moving forward with imaginative solutions.
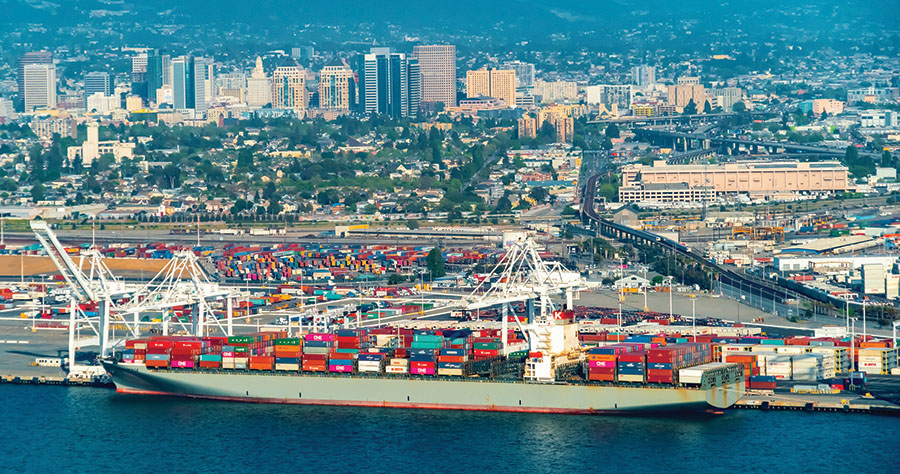
An outstanding symbol of that achievement was evident when the San Francisco Bar Pilots navigated the largest ship in North American history to the Port of Oakland last month.
The 1,312 foot-long MSC Anna—which is longer than Salesforce tower is tall—transported a backlog of empty containers and unloaded much-needed imports to support the Bay Area economy.
After having to rescue a virus-ridden passenger vessel Grand Princess in late March, the arrival of the MSC Anna was especially gratifying for Port of Oakland, which has growth aspirations despite recent cargo volume declines from the coronavirus pandemic.
According to Joseph Long, president of the Bar Pilots Association, preparations for the arrival of the MSC Anna included computer simulations at the Cal State Maritime Academy in Vallejo. The simulations contributed to a better understanding of navigational demands created by megaships, he explained.
“The San Francisco Bay is one of the most challenging pilotage grounds in the world and safely piloting these huge ships requires expertise and significant training,” say Long. “The COVID-19 crisis has highlighted the importance of the global supply chain to our region’s economy, and we’re pleased to continue our tradition of safety and service to support this vital part of the infrastructure.”
Meanwhile, outbound cargo continues to move out of the boutique port of San Francisco, as bar pilots are charged with navigating roll-on/roll-off vessels through the Gate from the ports’ pier 80 with newly-minted Tesla automobiles bound for the Far East. “It’s a different challenge,” says Long, “but one we welcome.”
According to Stacey Mawson, an analyst with Fitch’s Global Infrastructure group, shippers should expect the drop in cargo volumes for the first half of 2020 to exceed that experienced by most ports through the 2007-2009 timeframe, and to greatly exceed the effects from earlier events such as the severe acute respiratory syndrome (SARS) outbreak of the early 2000s or the Sept. 11 terrorist attack. Major gateway ports have seen 25% to 30% year-over-year volume drops in February, with greater declines expected in March.
Despite these pressures, Fitch expects there will be a demand floor as base levels of cargo will continue to move to meet industrial and consumer demand even in the face of an ongoing spread of coronavirus. “This is in contrast to sectors like aviation, where passenger movements may be essentially halted by quarantine orders and restrictions on travel,” says Emma Griffith, an analyst with Fitch’s Global Infrastructure group.
Additionally, Fitch’s rated ports benefit from a starting point of a strong financial profile, with the majority in the “A” category, and exhibit strong liquidity positions, which will serve to soften the negative impact of volatility in the near to medium term.
However, Fitch concludes this overview with a cautionary note on cargo ports that have embraced the passenger cruise industry in recent years (see sidebar).
“The ability for major cargo gateways to also maintain cruise terminals and the possibility for there to be restrictions in the future is not something we can easily answer, as it delves more into the potential for public health issues and public policy,” says Griffith. “We will be monitoring this space over the next year to see if there are restrictions or guidelines put in place.”
Finally, as things develop, Fitch will be monitoring how quickly consumer demand returns and the financial strength of the cruise line counterparties. Historically, the demand for cruises has been strong, even through recessions, and has not seen lasting dips after health scares. “However, given the magnitude of COVID-19, it remains to be seen if consumers will view this in the same way as past public health issues,” Griffith concludes.

Article Topics
Ports News & Resources
U.S.-bound import growth track remains promising, notes Port Tracker report Q&A: Port of Oakland Maritime Director Bryan Brandes Signs of progress are being made towards moving cargo in and out of Baltimore New Breakthrough ‘State of Transportation’ report cites various challenges for shippers and carriers in 2024 Industry experts examine the impact of Baltimore bridge collapse on supply chains Port of Baltimore closed indefinitely to ships after 1.6-mile Key Bridge collapses following maritime accident February and year-to-date U.S. import growth is solid, reports S&P Global Market Intelligence More PortsLatest in Logistics
Shipment and expenditure decreases trend down, notes Cass Freight Index March trucking tonnage trends down, reports ATA FTR Shippers Conditions Index enters negative territory DAT March Truckload Volume Index sees modest March gains National diesel average, for week of April 22, is down for the second straight week UPS reports first quarter earnings decline LM Podcast Series: Assessing the freight transportation and logistics markets with Tom Nightingale, AFS Logistics More LogisticsAbout the Author
Subscribe to Logistics Management Magazine

Find out what the world's most innovative companies are doing to improve productivity in their plants and distribution centers.
Start your FREE subscription today.
April 2023 Logistics Management

Latest Resources


