Study of Logistics and Transportation Trends: Navigating transportation’s Bermuda Triangle
20th Annual study of logistics and Transportation Trends (Masters of Logistics). Our annual study identifies three specific areas of logistics and transportation management that could yield disastrous results if not addressed. In 2011, those who accept the status quo may not be heard from for years to come.
Latest Logistics News
Under-21 driver pilot program a bust with fleets as FMCSA seeks changes Diesel back over $4 a gallon; Mideast tensions, other worries cited Four U.S. railroads file challenges against FRA’s two-person crew mandate, says report XPO opens up three new services acquired through auction of Yellow’s properties and assets FTR’s Trucking Conditions Index weakens, due to fuel price gains More NewsAlthough you won’t find it on any official map, seafarers claim the Bermuda Triangle as a place where ships, planes, and people have disappeared under circumstances beyond the explanation of ordinary man. Further investigation, however, has revealed that many of these mysterious cases involved inaccurate reporting or the exaggeration of the facts.
The results of our 20th Annual Study of Logistics and Transportation Trends (Masters of Logistics) suggests that logisticians now have their own Bermuda Triangle, one which, if left unattended, has the potential to create disastrous and inexplicable outcomes.
For the past two and a half years, companies have been simply reacting to what some economists and financial experts are calling the “new normal.” The hallmark of this new business environment is a sluggish economy that is forecasted to grow at an annual rate of just under 2 percent. To exacerbate matters, the new normal also has unpredictable and volatile change at both the demand and supply ends of the supply chain.
With this in mind, it’s now imperative that logistics and supply chain professionals learn how to navigate the waters of this strange new sea in order to help their companies survive and grow. To do this, they must institute new strategic plans and take actions that will effectively eliminate the clear and imminent hazards that the new normal has created.
Our Bermuda Triangle isn’t geographically related; in fact, the three points that constitute our version are interconnected at the strategic level of the enterprise.
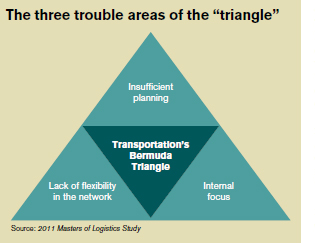 The Bermuda Triangle facing logistics and supply chain managers consists of:
(1) a lack of planning for the impact of rising fuel prices;
(2) a rigid network that is incapable of flexing when uncertainty occurs, and;
(3) a myopic internal focus that limits the enterprises’ ability to achieve the desired performance results.
DATA SAYS…
For the past 20 years, this study has identified emerging trends in the field of logistics and has provided benchmarking data on transportation performance and expenditures. This year, the research project was conducted by Georgia Southern University and the University of Tennessee in partnership with Con-way Inc., Ernst & Young, and Logistics Management.
We had 764 domestic and global logistics, transportation, and supply chain professionals participate in this year’s study, accounting for an estimated $18.6 billion in transportation expenditures and over $15.7 billion in international transportation. The Masters of Logistics - companies with annual sales greater than $3 billion - represented 17.7 percent of the study participants. Medium sized firms, between $500 million and $3 billion in annual revenue, accounted for 27.5 percent of respondents. The majority of respondents (54.8 percent) are smaller firms with reported annual revenue less than $500 million.
Respondent companies represent more than 14 industry sectors ranging from pharmaceuticals to food. Since the beginning of the study, the core group of participants has been in the manufacturing sector - this year that group represents 37.6 percent of the total. Consumer products companies represent the largest sub-sector of that group at 11.5 percent. The next largest sector taking part in this year’s study is energy, chemical, and mining, accounting for 9.8 percent of all participants.
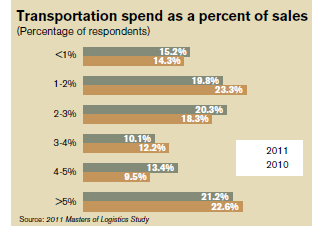 A key indicator for the state of transportation is transportation - spend as a percent of sales - and this trend over time has been an interesting one. From 2004 through 2007 North American domestic transportation spend as a percent of sales increased every year. In 2008 as the economy began to show signs of weakening, the percentage of firms spending more than 5 percent of sales on domestic transportation dropped significantly from 2007.
Spending increased again in 2009 and continued to rise in 2010 with some 22.6 percent of firms reporting that they spent more than 5 percent of sales on domestic transportation. This percentage dropped to 21.2 percent for 2011. Results show that the most significant change in domestic transportation spending as a percent of sales has occurred in the middle range. That is, firms that spent 1 percent to 2 percent of sales on domestic transportation last year (2010) are now spending 2 percent to 3 percent of sales on this activity. The same is true for those firms that spent 3 percent to 4 percent last year on sales - they are now spending 4 percent to 5 percent of sales on domestic transportation.
Further analysis of domestic transportation-spend as a percentage of sales by size of firm shows that the majority (57.4 percent) of small firms spend less than 3 percent of sales on this activity. This is compared to medium firms that spend more than 4 percent on average while the Masters’ domestic transportation-spend is 3 percent to 4 percent of sales on average.
International transportation spending as a percent of sales is also related to size of firm. In 2011, the majority (49.4 percent) of small size firms are spending less than 1 percent of sales for this service. Medium size firms spend on average 3 percent to 4 percent of sales on international transportation, while the Masters spend an average of 4 percent to 5 percent globally.
AREA 1: LACK OF PLANNING
How are firms trying to tack against a current of rising transportation costs? The data from this year’s annual study suggests that “tried and true” approaches are being used.
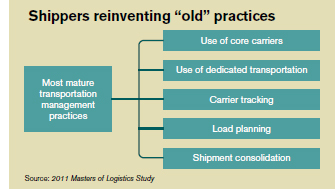
We asked study respondents about the level of maturity for a variety of actions and initiatives aimed at improving operating efficiency.
The top five most mature actions are:
(1) the use of core carriers;
(2) the use of dedicated transportation;
(3) carrier tracking;
(4) load planning, and;
(5) shipment consolidation.
Perhaps even more revealing is that more than half of the 22 actions and initiatives presented to participants had been completed for several years. Three other actions or initiatives that are poised to assist in keeping transportation costs in line include the use of new transportation technology; the use of ‘green’ carriers such as Smartway; and freight balancing or pooled distribution.
Interestingly, the use of intermodal shipments and sharing capacity forecasts with carriers or other service providers are the top two actions currently in the planning stages.
The analysis showed that there is no predominant action or project that is being used or planned to improve transportation efficiency. Instead it has been a combination of various fundamental approaches that has kept transportation costs in check or led to opportunities for short-term incremental savings.
According to Tony Ross, Ernst & Young’s senior manager of advisory services: “This suggests that innovation in transportation management is sorely needed in order to achieve breakthrough efficiency gains.” In fact, one of the designated points of our Bermuda Triangle is the lack of planning for the impact of rising fuel prices on operations.
When asked what primary action the company (or business unit) would take to offset the accompanying rise in transportation costs, the leading response was “no actions are currently planned.” This was followed - in rank order - by “increases will be passed along to the customer,” “improved load planning,” and “improved route planning.” The first two options will be unacceptable to management at the “C” level who will expect a response that will deliver results. The latter two actions, improved load and route planning, are execution oriented. While this level of action will produce results, it can be a short-term, sub-optimal approach.
Improved route planning tied with network optimization/redesign is a way to offset a rise in transportation costs. It’s at this strategic level that a long-term, “best line of attack” can be formulated to avoid what appears to be unexplained mishaps in the Triangle. “Moreover, using an optimization tool will allow the company to gain an understanding of how sensitive the network will be to future increases or changes in other costs such as duties/tariffs, commodity prices, or demand and supply shifts,” adds Ross.
Surprisingly, when asked what changes would happen to the supply chain network if diesel fuel rose to $5 a gallon, an alarming 47.9 percent of the study participants reported that their network would not change. Balancing this, an almost equal proportion indicated that some to moderate changes would be made to the network.
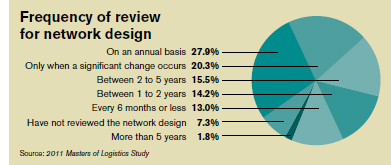 Data show that 27.9 percent of the study participants review their network design on an annual basis. However, it’s imperative that the results of these reviews be translated into tactics and then operational actions. The data Frequency of review also suggest that these links are currently not for network design as strong as needed. Furthermore, 20.3 percent of the study respondents reported that they only review their network design when there’s a significant change, such as a merger, acquisition, or divestiture.
We suggest that this timing leaves a tremendous amount of opportunity on the table, and it potentially enables competitors to close or increase their competitive advantage if they are reviewing their network design more frequently.
AREA 2: INFLEXIBLE NETWORK
At an operational level, cost-to-serve and energy (fuel) prices affect transportation choices. It’s not surprising therefore that supply chains use truckload (TL) as the principal mode for moving freight.
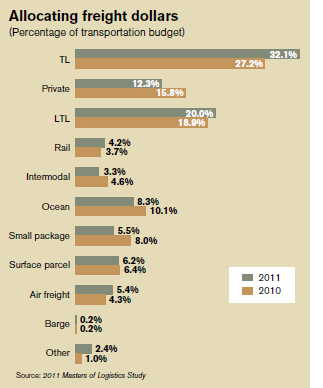 The data for 2011 indicate that TL’s share of the transportation budget increased to 32.1 percent as compared to 27.2 percent for 2010. This increase was the largest modal gain for 2011. LTL accounted for 20.0 percent of the transportation budget in 2011, representing the second largest modal expenditure for the firm - a 5.8 percent increase in share of the budget as compared to 2010. In fact, combined TL and LTL capture the vast majority of freight expenditures; and for 2011, this is 52.1 percent of total transportation spend.
In 2010, the combined total was 46.1 percent of transportation spend and 53.9 percent in 2009. These percentages do not compare to 2008, however, when TL and LTL commanded 64 percent of the total transportation budget primarily due to LTL’s 28.0 percent share of the total bud-get - the highest percentage reported since the inception of the annual study.
The increase in the percentage of the budget for TL in 2011 resulted primarily due to less of the budget being allocated to the private fleet. This could be the result of a shift away from the use of private fleets, or, more likely, based on the fact that costs in the private fleet didn’t increase as quickly as the other modes. This mode still remains a viable transportation option for many firms, commanding 12.3 percent of the budget in 2011 - a 22.1 percent decline from 2010 levels and approximates the percent expenditure in 2009 for this mode.
Small package carriers, ocean, and intermodal all reported a smaller share of the transportation budget in 2011 as compared to the previous year. In addition to increases in TL and LTL, the percentage of the transportation budget allocated to airfreight also grew from 4.3 percent to 5.4 percent from 2010 to 2011.
It’s interesting to note that transportation spend for intermodal continues to decline from its high in 2009 at 5.4 percent of the budget.
While there are changes in the allocation of the transportation budget across the various modes from year to year, the ranking of the modes by percentage of the budget hasn’t changed since this study began in 1991.
Truckload, LTL, and private fleets command the largest share of the freight budget in North America. On average, these three modes account for around 60 percent of the total budget. Data from this year’s study show that selecting a transportation mode is based on three key factors: freight costs, lead or transit time requirements, and reliability.
“Transportation plays a lead role in the firm’s pursuit to improve supply chain flexibility,” says Con-way’s Tom Nightingale, vice president of communications and chief marketing officer. The study data indicate that the top initiatives completed to date to improve supply chain flexibility include the use of multiple transportation modes to meet delivery schedules, the use of freight brokers for shipping needs, and the increased use of multiple transportation modes to meet delivery schedules.
“These actions are tactical and operational,” says Nightingale. “While they can be part of a larger plan to improve supply chain flexibility, they are not sufficient in and of themselves to achieve this goal.”
 Where should shippers spend their time to make sure they’re navigating away from this corner of the triangle? The data show that many of the actions that have the capability to improve supply chain flexibility are in the planning stage.
They include reducing supply and order-fulfillment lead time; improving integration of information systems with external customers and suppliers; and increasing collaboration with key suppliers. “It’s critical that these actions move from the planning stage to implementation as soon as possible given the current ability of the firm to deal with uncertainty that is ever-present in the supply chain,” adds Tony Ross.
AREA 3: INTERNAL FOCUS
Determining how to increase supply chain flexibility and optimally plan for future impacts to the network is challenging for any logistics manager. The task is even more difficult due to the triangle’s third corner.
The study results indicate that there remains a meaningful planning gap between the firm and its key customers and suppliers. This gap results in a myopic, internal focus that limits the degree to which the firm engages its key supply chain partners in strategic initiatives such as sales and operations planning (S&OP) and company-wide inventory reduction initiatives.
The data show that only 7.5 percent of key suppliers and 6.3 percent of key customers are highly involved in the S&OP process. Yet collaborative forecasting/demand planning is cited as the primary method being used by the firm to reduce company-wide inventory levels. The expected benefits from the inventory reduction initiative are targeted for 5 percent to 15 percent on average.
Engaging suppliers and customers in supply chain initiatives, especially at the planning stage, has the potential of improving everyone’s efficiency and effectiveness. The bright spot on the horizon is that many study participants reported that they are currently implementing increased collaboration with key customers and suppliers.
“The benefit of the information sharing has been noted in transportation, where nearly 30 percent of the survey respondents are already sharing capacity forecasts with their carriers,” says Nightingale. “This helps us keep our costs - and of course our rates - more competitive.
TAKING THE MYSTERY OUT OF THE BERMUDA TRIANGLE
Many of the catastrophes and losses within the geographic Bermuda Triangle can be attributed to faulty or missing data, lack of proper training, and human error. We would be wise to warn logistics professionals that these factors yield the same effect when considering our logistics and transportation Bermuda Triangle.
For example, successful transportation moves are heavily dependent on utilizing the right tools in the right way. As freight transportation has become more complex due to the global nature of the supply chain, more sophisticated methods for strategic, tactical, and operational decision making are needed.
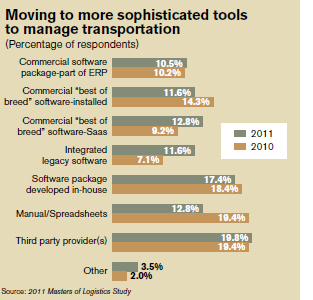 Over the years of conducting this study, our growing concern has been that a large percentage of companies have used and continue to use manual/spreadsheets and software developed in house to manage transportation. In 2009, 24.6 percent of study participants reported that they used manual techniques or spreadsheets for domestic transportation management.
This percentage dropped to 19.4 percent in 2010, and the data for 2011 indicate that only 12.8 percent of companies rely on this method. The data indicate that there has been a move away from less sophisticated tools and techniques to commercially purchased “best of breed” Software-as-a-Service (SaaS) solutions that integrate legacy systems, spreadsheets, email, and Web-based portals through a non-intrusive software platform.
The percentage of respondents using software developed in house has not changed significantly over the past few years. Currently 17.4 percent of companies use this approach to manage domestic transportation.
One hurdle of using manual methods, spreadsheets, and software developed in house is that they make it very difficult to achieve the level of visibility that’s needed for a seamless flow of data and information in a supply chain. Highly visible data and information increases the likelihood for more optimal decision making.
Avoiding the logistics and transportation Bermuda Triangle isn’t that difficult - it means separating folklore from reality. Successful navigation requires planning in advance of potential hazards and working with partners to maximize current efforts.
Last, but not least, it involves future thinking in order to plot a course toward innovation. Those who accept the status quo may not be heard from in the years to come.
—Mary Collins Holcomb, Ph.D., and Karl B. Manrodt, Ph.D. are frequent contributors to Logistics Management

Article Topics
Latest in Logistics
Under-21 driver pilot program a bust with fleets as FMCSA seeks changes Diesel back over $4 a gallon; Mideast tensions, other worries cited Four U.S. railroads file challenges against FRA’s two-person crew mandate, says report XPO opens up three new services acquired through auction of Yellow’s properties and assets FTR’s Trucking Conditions Index weakens, due to fuel price gains U.S. rail carload and intermodal volumes are mixed, for week ending April 6, reports AAR LM Podcast Series: Examining the freight railroad and intermodal markets with Tony Hatch More LogisticsAbout the Author
Subscribe to Logistics Management Magazine

Find out what the world's most innovative companies are doing to improve productivity in their plants and distribution centers.
Start your FREE subscription today.
April 2023 Logistics Management

Latest Resources


