Site Selection/Ports Update: Rising economic tide boosts North American ports
As the economy and GDP grows, so too does container volume. But some North American ports are capitalizing on their competitive advantages and growing faster than the overall market.


The logistics landscape is ever-evolving as shippers adopt new supply chain strategies and adapt to diverse and variable market pressures. Ports, too, are adapting to succeed in today’s changing market and rise to the challenges associated with the rapid upsizing of container ships (see sidebar). And in this global and expanding e-commerce world, the choice of where shippers locate distribution center (DC) operations and which ports they choose to employ has a meaningful impact on margins.
Because a significant amount of U.S. imports are shipped through Canadian ports, this ports update will take a look at Canada and the U.S. as a single North American market. The vast majority of non-NAFTA trade volumes arrive by ship; thus seaports are central features of the logistics landscape.
Most manufactured goods are shipped in containers because this alleviates the need to handle the commodities at the port. Instead, the containers can be loaded directly onto trucks or railcars and transported to a regional distribution center for deconsolidation and delivery. Container trade volumes are best forecasted using a top-down macroeconomic approach that accounts both for differential tradelane growth rates and for the order in which ports are called.
Typically, the largest market in a service rotation will be called first, and intermodal volumes destined for inland markets will be discharged there. With half of the population residing in inland markets, inland intermodal and truck volumes are important revenue generators for ports that attract first inbound calls.
In short, a container port’s volume will depend on the tradelane mix of services calling the port, the headhaul direction of each of these tradelanes (imports have been growing faster than exports), where the port sits in the port rotation, and the ability of the port to accommodate increasingly large vessels.
Why does this matter to shippers? Port volumes reflect current market conditions and are a measure of “group think” among shippers. But there is a catch. The alignment of many thousands of individual supply chain decisions leads to differential port volume growth rates, and the fastest growing ports face the biggest challenges in managing congestion.
In our modern logistics landscape, shippers must account not only for conditions that affect logistics costs, transit times and reliability today, but also anticipate how these metrics are likely to evolve tomorrow and over time when setting up distribution networks and siting distribution centers.
Container port outlook
Many economists have expressed concern over the fact that global trade has been growing at rates that have been close to parity with global GDP. While this may be true in dollar terms, global container volumes continue to grow at a multiple of world GDP—and the same is true in North America.
Since recovering from the global financial crisis, loaded inbound container volumes associated with the North American import headhaul tradelanes (NE Asia, SE Asia, Northern Europe, the Mediterranean, Central America, South America and the Indian Subcontinent) have expanded at a compound annual rate of 4.2%, which is approximately double the 2.1% compound annual rate of growth for the combined U.S. and Canadian economy. In order to accommodate this growth, carriers have upsized vessels.
The relationship between total container volumes and real GDP is linear and highly correlated. This means that each unit of real GDP growth is associated with a constant number of containers. The strength of this relationship is remarkable considering how global trade has evolved over the last 30 years.
The high correlation means that there is a strong tendency for mean reversion—a fancy way of saying that when volumes underperform expectations one year, they are likely to overperform expectations the following year. For example, loaded inbound volumes grew just 2.9% in 2016, but bounced back growing 8.1% in 2017.
And as the economy grows so too do container volumes—and they do so in a predictable manner. But, while a rising tide may lift all boats, some will rise faster than others. The following ports—presented in geographic order—are likely to grow faster than the overall market.
Port of Prince Rupert
2017 Loaded Inbound (LD/IB) volumes up 20.8%
Located more than 450 miles north of Vancouver, British Columbia, the Port of Prince Rupert enjoys two strategic advantages that have contributed to make it one of the fastest growing ports in North America. The first advantage is geographic. Prince Rupert is the first container port that is encountered by vessels traveling the great circle route (i.e. the most direct route) from Asia.
Prince Rupert also receives favorable pricing from the Canadian National Railway, which has rail lines running east across Canada and south from
Winnipeg through Chicago and on to New Orleans.
Prince Rupert is currently undergoing an expansion, and volumes should grow to capacity in coming years. This is expected to be the case even though the NE Asia tradelane is expected to continue to lose share to the SE Asia tradelane that has volumes split between services calling the North American Pacific Coast and the Atlantic Coast via the Suez Canal.
The largest vessels currently calling Prince Rupert have a nominal capacity of around 10,000 TEUs, but vessels with 14,500 TEU capacities have called there in the past. Prince Rupert could be challenged to further growth by rail constraints, however, and this could erode the relative attractiveness of the port as rising volumes could negatively affect service levels.
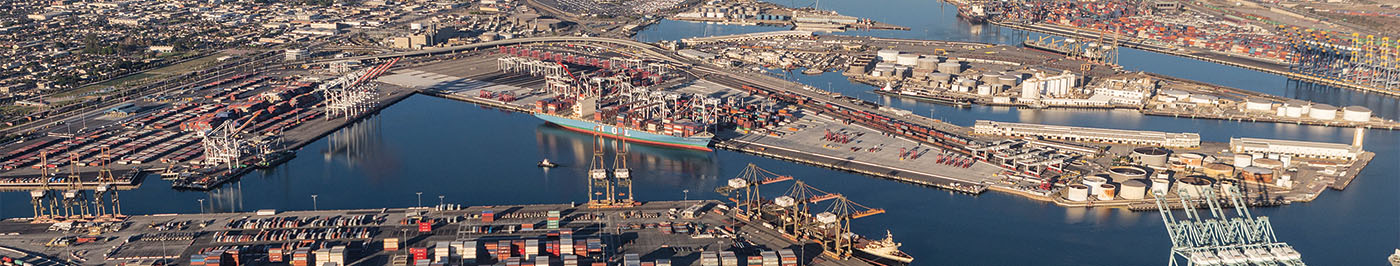
Los Angeles/Long Beach (LA/LB) Port Complex
2017 LD/IB volumes up 7.4%
Despite rapid growth in 2017, LA/LB is not expected to gain market share over the long-term, but as the largest port complex in North America, it deserves attention. LA/LB’s primary asset is that it has one of the largest hinterland markets on the continent.
The sheer size of the Southern California market would be sufficient for attracting a lion’s share of first inbound calls on Asia services calling the Pacific Coast, but the LA/LB hinterland extends far inland and includes Las Vegas, Salt Lake City, Denver, Phoenix, Tucson, Albuquerque, and El Paso.
The LA/LB port complex also counts a well-developed railroad network as an important competitive advantage. The BNSF runs double stack unit trains east from the port complex on double track rail to Dallas and Fort Worth, as well as northeast to Chicago. The largest vessels currently calling this port complex have a nominal capacity of around 14,400 TEUs.
The main risks to LA/LB port complex competitiveness are associated with the expansion of Prince Rupert, which competes for intermodal volume to the U.S. Midwest, and the opening of the new locks of the Panama Canal, which has shifted ocean shipping economics in favor of importing goods into the Dallas/Fort Worth area through the Port of Houston.
Port of Houston
2017 LD/IB volumes up 21.6%
Dallas and Fort Worth are two of the top five fastest growing cities in North America. A third, Austin, is in the top 10, and two more, San Antonio and McCallan, also make the list of the top 25 fastest growing cities. This, in combination with the Panama Canal expansion, have set the Port of Houston on a course for rapid growth as importers of Asian goods are increasingly opting for “all water” routing through Houston to serve these markets. The largest vessels currently calling Houston have a nominal capacity of around 8,500 TEUs.
Port of Savannah
2017 LD/IB volumes up 12.3%
Savannah has been one of the fastest growing container ports in recent years, and it is the largest container port in the South Atlantic by a factor of two. Savannah is the first inbound port called on many Asia services calling the South Atlantic, and even on some that also call North Atlantic ports.
The Port of Savannah has excellent rail (CSX and Norfolk Southern) and road access to Atlanta, Nashville, Charlotte, Birmingham, and Chattanooga. The Atlanta metro area is the seventh largest in the nation, and Nashville is the seventh fastest growing city in the U.S. Charlotte also makes the top 20 fastest growing cities. The largest vessels currently calling Savannah have a nominal capacity of around 14,400 TEUs, and this is the same for both Charleston and New York.
Port of Charleston
2017 LD/IB volumes up 8.1%
In terms of throughput, the Port of Charleston is half the size of Savannah, but like Savannah, Charleston has good rail and road access to the large population living along the I-84 corridor from Atlanta to Raleigh-Durham.
The Port of Charleston has begun construction on a new container terminal, but construction is not slated to be completed until 2020, so the upside opportunity here might be slightly delayed. Over the long run, however, we can look to Charleston to capture share of the South Atlantic volumes.Port of New York/New Jersey (PANYNJ)
Port of New York and New Jersey
2017 LD/IB volumes up 6.1%
PANYNJ is the second largest port complex in North America (behind LA/LB), and this is due to the port having the largest hinterland market on the Atlantic Coast. Until recently, the air draft of the Bayonne Bridge presented a major growth constraint, but this constraint was eased when the Bayonne Bridge was raised from 151 feet to 215 feet in mid-2017. The new air draft is sufficient to allow all but the largest container ships to navigate the channel to call the APMT, PNCT, Maher, and GCT New York terminals of this port complex.
PANYNJ is also investing in improvements to on-dock/near-dock intermodal rail capacity, which should further benefit its competitive position in relation to its North Atlantic competitors. That said, PANYNJ is challenged by congestion associated with moving goods inland through the largest metropolitan area in North America.
Port of Halifax
2017 LD/IB volumes up 14.3%
Like Prince Rupert, the Port of Halifax lacks a large hinterland market, but it enjoys a geographic advantage in being the first port in North America encountered by ships carrying goods from North Europe, the Mediterranean, and Asia via the Suez Canal.
The Port of Halifax also offers an exchange rate advantage over the ports of New York/New Jersey, Boston and other U.S. East Coast ports. Increasingly Halifax could provide an outlet for intermodal volumes destined for Eastern/Central Canada as well as the U.S. Midwest, as the Canadian National can carry these volumes. The largest vessels currently calling Halifax have a nominal capacity of around 11,000 TEUs.
Vessel upsizing trends
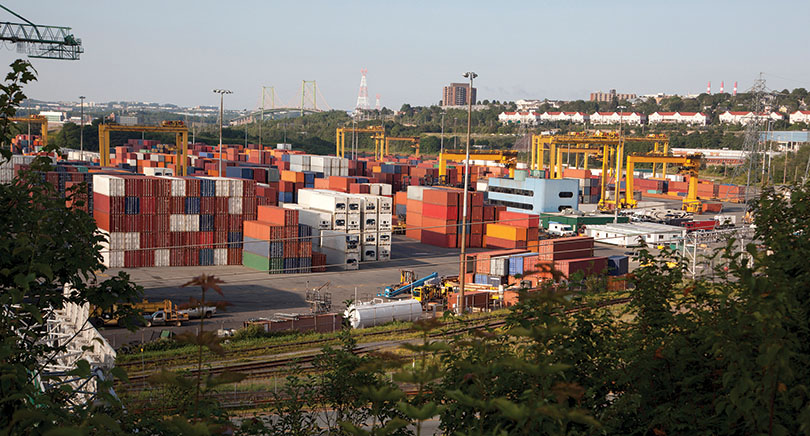
 Over the last decade and a half, container volumes moving over North American ports have doubled. To accommodate this growth, carriers have added new services and greatly increased the sizes of vessels deployed on these services.
Between 2002 and 2017, more than 3,800 new containerships were added to the global fleet, and the nominal capacity of these new ships totals more than 18 million TEUs. Prior to 2005, there were no containerships with nominal capacities above 10,000 TEUs.
Last year, more than 80% of the total capacity delivered to the market was associated with ships with nominal capacities more than 10,000 TEUs, with the largest ships having nominal capacities over 21,000 TEUs.
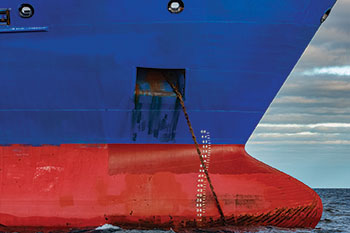
Carriers are motivated to deploy ever-larger ships by significant economies of scale. Holding all else constant, the operating cost per nominal TEU for a 20,000 TEU vessel is around one-third lower than it is for a 10,000 TEU vessel.
Here we see the law of diminishing returns, however, as there are few efficiency gains to be had in vessels much larger than 21,000 TEUs. And from a landside perspective, unit costs associated with ever-growing volumes being discharge per call are in some cases on the rise.
The largest vessels are, of course, deployed on the highest volume tradelanes, and the vessels that they displace when brought into rotation are cycled to the second tier tradelanes. Through a “cascade” effect, the nominal vessel size has increased across most services in recent years.
From a port perspective, it’s critical to recognize that carriers can, and often do, add and drop ports from service rotations, and if a carrier sees an economic case for upsizing a service, and a port can’t accommodate the larger vessels, this port will be dropped from the rotation and could potentially lose volume.
—Derik Andreoli, Mercator International, LLC
Staying competitive
Seaports derive competitive advantages from having large or fast-growing hinterland markets. Ports that attract first inbound calls have a competitive advantage in attracting volumes that are destined for final consumption in inland markets. And, they derive competitive advantage from the mix of the tradelanes they serve.
We expect Asia to maintain its share of the North American market, but SE Asia will gain share at the expense of NE Asia as rapidly rising wages in China favor outsourcing to lower wage countries in SE Asia.
The Transatlantic tradelane is expected to continue to regain market share that was lost as Europe recovered more slowly from the global financial crisis than most other regions—this is especially true for countries that contribute volumes to the Mediterranean tradelane.
Prior to the financial crisis, trade with Latin America boomed. This boom was driven by a combination of the containerization of foodstuffs and a rapid inflow of foreign direct investment associated with the commodity price bubble. Since the crisis, this tradelane has lost share, and this is likely to continue.
As port volumes grow, carriers will continue to pursue economies of scale associated with ever-larger vessels. Consequently, ports must continue to invest in programs that address challenges associated with water depth, air draft restrictions and turning basins; and terminal operators must continue to invest in cranes, equipment and new technologies to handle these vessels and the large volumes that are discharged during each call.

Article Topics
Columns News & Resources
A new day at the post office Despite small decline, Services economy remained strong in April, reports ISM U.S. Senate signs off on confirmation of two new STB Board members Moore On Pricing: The business case for transportation management How to Solve the Digital Transportation Puzzle Process and technology in balance Cold Chain and the USPS Crisis More ColumnsLatest in Logistics
LM Podcast Series: Assessing the freight transportation and logistics markets with Tom Nightingale, AFS Logistics Investor expectations continue to influence supply chain decision-making The Next Big Steps in Supply Chain Digitalization Warehouse/DC Automation & Technology: Time to gain a competitive advantage The Ultimate WMS Checklist: Find the Perfect Fit Under-21 driver pilot program a bust with fleets as FMCSA seeks changes Diesel back over $4 a gallon; Mideast tensions, other worries cited More LogisticsSubscribe to Logistics Management Magazine

Find out what the world's most innovative companies are doing to improve productivity in their plants and distribution centers.
Start your FREE subscription today.
April 2023 Logistics Management

Latest Resources


