Top 30 Ports: Volumes swell, challenges persist
Schedule reliability remains a significant headache for carriers. Meanwhile, seaports remain flooded with containers, labor negotiations on the West Coast are ongoing, and issues regarding congestion are slow to be resolved as ports continue to look for answers.
 U.S. seaports are facing the worst congestion they’ve seen since the age of containerization. The culprit: backlogs of imports coming into the United States, a shortage of equipment, and inland logjams.
“U.S. seaports face the unprecedented situation where they’re now in their 17th straight month [as of March 2021] of record container import volume,” says Chris Jones, executive vice president of industry and service at trade intelligence firm Descartes Datamyne. “Consequently, continuous and shifting congestion and delays, and unpredictable lead times for importers has resulted.”
The Ports of Los Angeles (POLA) and Long Beach (POLB), which handle approximately 40% of U.S. imports, are ground zero for the crisis. As 2021 ended, more than a hundred vessels waited to berth at Los Angeles for more than two weeks. POLA closed 2021 having handled 5,667,381 TEUs, a 17% gain over 2020 totals.
In July, POLA processed an estimated 935,345 TEUs, outpacing the previous record set in 2019 by 2.5%. Last year, the Port of Long Beach experienced an increase of 16% in TEUs. This July, POLB handled 785,843 TEUs—its busiest July on record despite a cooldown in consumer spending. In fact, the top five West Coast ports saw total throughput decline 40.6% in July. By comparison, the top five East Coast ports held steady
at 44.4%.
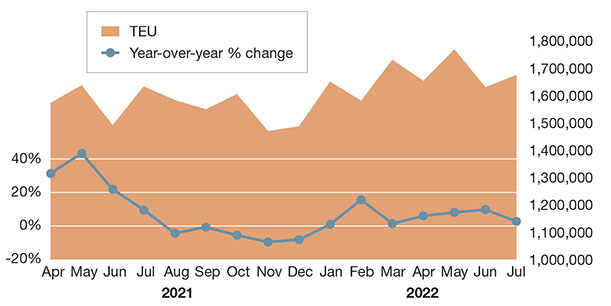
Imports from China remain high and increased July over June vs. expected decline
(Total monthly TEU volume of U.S. containerized imports from Asia, with year-over-year change)
Third ranked Port of New York/New Jersey closed 2021 with 4,651,094 TEUs handled, up 19.5% over 2020. Contributing to that growth were South Asia imports, which increased 36.1% in 2021, and ship diversions to the East Coast largely because of shorter delays. On average, December shipments cleared four days faster than at either of the San Pedro Bay ports.
“Part of the reason for the shift to East Coast ports can be attributed to the growth of Chinese imports getting around West Coast port congestion,” says Jones.
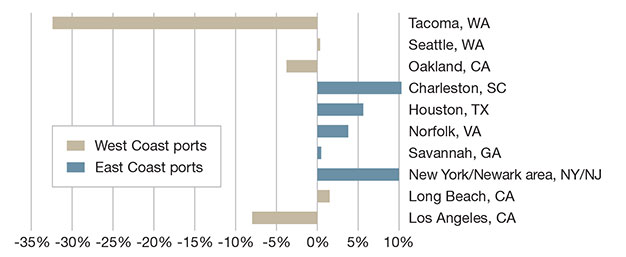
In July 2022, for example, the ports of Savanah, Houston and Charleston saw 24.8%, 20.3% and 19.0% growth, respectively. The only West Coast port that saw a similar increase was Seattle at 25.9%. Long Beach saw the greatest decline at -7.3%. “Overall, volume shares of the top 10 edged down to 85.1% in July 2022, compared with 86.7% the month before and 87.5% year-on-year,” adds Jones.
U.S. port congestion
(Container congestion in million TEUs; 7-day moving average)
Top 30 U.S. Ports
By TEU Ocean Imports 2021
| Rank | Port | 2021 TEU | 2020 TEU | TEU Change | 2021 Shipments | 2020 Shipments | Shipments Change |
| 1 | Los Angeles, CA | 5,667,380.96 | 4,832,329.68 | 17.29% | 2,886,565 | 2,516,304 | 14.71% |
| 2 | Long Beach, CA | 4,687,541.44 | 4,042,278.80 | 15.97% | 2,488,938 | 1,920,825 | 29.58% |
| 3 | New York-New Jersey | 4,651,094.37 | 3,891,768.53 | 19.52% | 2,548,560 | 2,087,357 | 22.10% |
| 4 | Savannah, GA | 2,815,808.43 | 2,307,444.35 | 22.04% | 1,089,745 | 855,167 | 27.43% |
| 5 | Houston, TX | 1,663,157.55 | 1,290,192.02 | 28.91% | 720,104 | 558,578 | 28.92% |
| 6 | Norfolk, VA | 1,617,583.47 | 1,258,787.99 | 28.51% | 683,213 | 520,286 | 31.31% |
| 7 | Charleston, SC | 1,302,872.99 | 1,033,118.12 | 26.12% | 518,496 | 409,582 | 26.59% |
| 8 | Oakland, CA | 1,062,876.32 | 986,106.34 | 7.79% | 408,560 | 796,266 | -48.69% |
| 9 | Tacoma, WA | 856,706.05 | 738,770.59 | 15.97% | 416,602 | 353,801 | 17.75% |
| 10 | Seattle, WA | 754,804.55 | 617,998.06 | 22.14% | 320,237 | 246,089 | 30.13% |
| 11 | Miami, FL | 576,535.04 | 488,147.20 | 18.11% | 314,712 | 272,571 | 15.46% |
| 12 | Baltimore, MD | 484,420.48 | 512,314.18 | -5.45% | 214,234 | 206,944 | 3.52% |
| 13 | Philadelphia, PA | 435,833.74 | 377,818.43 | 15.36% | 159,929 | 138,066 | 15.84% |
| 14 | Port Everglades, FL | 367,661.23 | 300,541.07 | 22.34% | 174,830 | 140,469 | 24.46% |
| 15 | Mobile, AL | 258,576.91 | 212,351.94 | 21.77% | 120,806 | 101,947 | 18.50% |
| 16 | San Juan, PR | 219,502.61 | 195,107.94 | 12.51% | 98,145 | 90,192 | 8.82% |
| 17 | Jacksonville, FL | 208,400.48 | 227,808.07 | -8.52% | 76,010 | 78,802 | -3.54% |
| 18 | Wilmington, DE | 190,740.60 | 197,000.31 | -3.18% | 23,888 | 21,934 | 8.91% |
| 19 | Chester, PA | 132,905.44 | 114,022.44 | 16.57% | 62,776 | 54,273 | 15.67% |
| 20 | New Orleans, LA | 125,983.79 | 135,847.37 | -7.27% | 53,101 | 49,991 | 6.22% |
| 21 | Wilmington, NC | 121,409.58 | 125,104.97 | -2.96% | 49,774 | 46,304 | 7.49% |
| 22 | Port Hueneme, CA | 114,637.04 | 87,403.33 | 31.16% | 31,877 | 19,382 | 64.47% |
| 23 | Boston, MA | 93,003.13 | 137,285.51 | -32.26% | 48,704 | 66,002 | -26.21% |
| 24 | Gulfport, MS | 85,490.80 | 77,063.74 | 10.94% | 22,109 | 18,470 | 19.70% |
| 25 | Tampa, FL | 82,207.14 | 76,225.83 | 7.85% | 30,168 | 28,303 | 6.59% |
| 26 | San Diego, CA | 80,171.73 | 73,629.36 | 8.89% | 35,998 | 33,609 | 7.11% |
| 27 | Port Manatee, FL | 73,384.09 | 52,619.05 | 39.47% | 14,186 | 12,576 | 12.80% |
| 28 | Portland, OR | 43,560.62 | 20,939.53 | 108.04% | 22,457 | 7,720 | 190.89% |
| 29 | Freeport, TX | 31,494.34 | 26,370.45 | 19.44% | 10,940 | 8,614 | 27.00% |
| 30 | West Palm Beach, FL | 29,972.35 | 25,663.77 | 16.79% | 30,726 | 28,543 | 7.65% |
Consistent schedule issues
Schedule reliability remains a significant challenge for carriers. “Lead times have been very fluid,” says Jones. “Last year, West Coast ports experienced long delays, and now it’s the East and Gulf Coast ports. This makes it hard for carriers to predict when containers will be available for their customers. There is a knock-on effect for subsequent schedules if vessels are delayed at ports.”
The Port of Savannah, in particular, has been reporting record volumes. Since January, the port has moved 3.4 million TEUs, up 231,400 or 7% over its performance during the same period in 2021. Concurrently, the port is experiencing mounting ship delays. GoComet, which tracks ship delays at seaports, found that in August those ranged from approximately 12 days to 37 days.
“This is why recently Savannah is now the congestive champion, taking the position from Long Beach,” says Stefan Verberckmoes, analyst at Alphaliner. “Savannah is now the most congested port in America.”
Meanwhile, a trend is emerging whereby shippers are increasingly turning to smaller, under-utilized ports. One major beneficiary last year was Oregon’s Port of Portland, which gained largely from shipments diverted from Los Angeles and Long Beach. Consequently, Portland’s TEUs from East Asia increased 101.2%, and volumes from Southeast Asia gained 144.7% in 2021 compared with 2020.
Frankie Mossman, chief customer officer at Overhaul, a supply chain risk management firm, predicts an emergence of alternate network designs to leverage the use of secondary ports. “We’ve seen a huge increase in bookings via Houston, Baltimore, and Port of New Jersey,” he says. “Typically lead times can be longer but more predictable—so we’re seeing this propensity for not just a Plan B, but Plan Cs and Ds.”
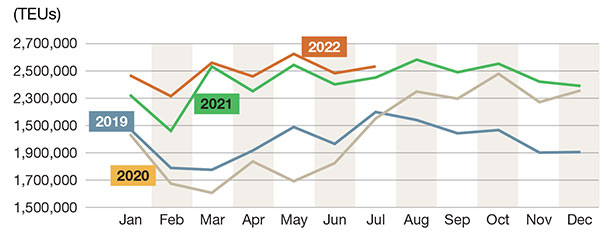
U.S. container import volume year-over-year comparison
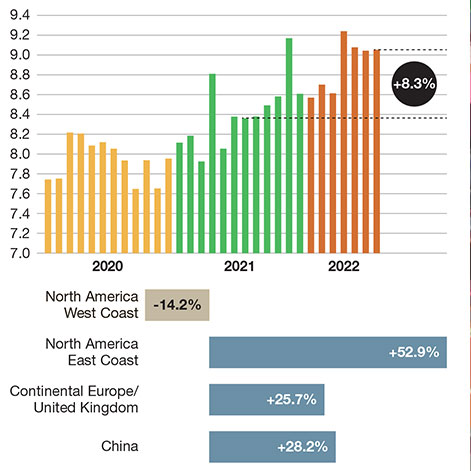
Container import volume shifts at top 10 ports
(Volume shift May-September 2021 vs. February-June 2022)
Labor issues
Another major issue affecting U.S. seaports is labor. Labor negotiations that have taken place at West Coast ports have been significantly affecting shippers who remain concerned about slowdowns and potential strikes.
“Part of the backlog that’s been taking place is due to shippers shifting their freight to the U.S. East Coast when labor negotiations started on the West Coast in anticipation of potential delays,” says Mike Short, president of global forwarding at C.H. Robinson. “One way C.H. Robinson is helping customers with port congestion is sorting our customer’s freight at the port—some refer to it as a ‘secondary supply chain.’”
Recently, the International Longshore and Warehouse Union (ILWU), which represents 22,000 West Coast dockworkers, and the Pacific Maritime Association (PMA), whose membership comprises 70 ocean carriers and terminal operators who operate at the 29 West Coast Ports, have been at loggerheads over who maintains equipment at a terminal at the Port of Seattle.
Monthly average delays at top 10 ports
(Days)

The dispute threatened disruptions at major U.S. gateways that handle trans-Pacific trade. It also came on the heels of earlier clashes over automation. Consequently, shippers are uncertain whether to keep diverting to the East and Gulf Coasts or resume shipping on schedule to the West Coast.
“East and Gulf Coast ports, however, don’t have the overall capacity to be efficient and properly manage the additional volume,” comments Spencer Shute, senior consultant at procurement services firm Proxima. “With no agreement in place, it’s unknown at this time how the United States will handle the volume that’s expected.”
There are other concerns, most notably California Assembly Bill 5 (AB5), which affects independent truckers. AB5 sets tough standards for classifying workers as independent contractors, meaning that many independent truckers who are owner-operators are at risk of losing their ability to work because AB5 regulates the relationship between owner-operators and carriers and set tests that are difficult to meet.
Rail workers are also facing labor issues and threatening to strike. This not only would affect U.S. seaports, but the already inflationary economy. About one-third of exports are shipped via rail.
Port leverage
To counter these problems, U.S. ports need modernization, which requires a significant amount of funding. “We’ve started to see investment and positive movement in some areas,” says Shute.
For instance, the Port Infrastructure Development Program (PIDP) provides a $2.25 billion investment allowing ports to apply for a $450 million grant to help improve supply chain, port efficiency, and resiliency. Ports are also focusing on data visibility and finding ways to become more efficient.
“This requires a lot of groundwork to understand the current state of ports: what their capacity is; where the gaps are; and then how they can get and use real-time data to start making operational changes that affect efficiency,” Shute says.
It’s not an overnight fix, but data from ports is starting to flow much more rapidly and with increasing volume. The U.S. Department of Transportation Freight Logistics Optimization Works (FLOW) program, a big data-sharing initiative, aims to help move goods more quickly and more cost effectively.
“They’re trying to do proof of concept, and since they’ve started ramping up the data sharing, it seems to be on the right track,” says Shute. “While it may take three years to four years to see significant investments and improvements in this space, there’s a lot of progress being made to ensure decisions are driven by leveraging data and technology properly.”
According to Shute, ports are also considering other practical solutions, such as how they stack containers and optimize traffic flow without creating bottlenecks.
Going forward
Other factors continue to affect port volumes. The Russia-Ukraine war has created issues getting goods by rail from China across Russia to Europe, thereby creating backlogs for shippers and pushing more freight to ocean. This is putting pressure on carriers already facing capacity issues.
The political climate regarding China and Taiwan also raises issues regarding the shipment of technology components and raw materials, thereby pushing shippers to consider nearshore sourcing.
“While it’s premature to say what the direct impact is going to be on supply chains and particularly ports, many supply chain managers are starting to plan for alternative solutions,” Shute says.
Inflation is another area to track. “We will probably start to see some softening in terms of overall demand, which is going to help alleviate the volume issues,” Shute adds. But again, backlog issues remain. “How long and how high inflation continues to be is going to dictate some of the future volumes.”
In the meantime, seaports remain flooded with containers and issues regarding congestion are slow to be resolved.
Digitalization: A long-term solution
Along-term, albeit challenging, solution to port congestion could be digitalization.
“Digitalization—and increasing ‘connected freight’—are definitely trends on the rise,” says Frankie Mossman, chief customer officer at Overhaul. “Visibility and transparency across entire port operations are the weakest points, as is evident in how once one capacity challenge is resolved a new one pops up downstream.”
Nalin Jain, president of Wabtec’s digital electronics business, refers to the Port of Los Angeles as the American pioneer for digitalization by becoming the nation’s first and only port community to digitizes maritime shipping data.
Today the port uses Wabtec’s Port Optimizer software that allows supply chain stakeholders to better predict and plan cargo flows, and this year added new features that provide single view visibility for 70% of the import data for all 12 container terminals in the port complex.
Accordingly, the Port of Oakland has a program underway called the Freight Intelligent Transportation System (FITS), a suite of 15 technology projects throughout its maritime area that will measure and manage cargo flow, and is intended to improve truck traffic flow, increase the efficiency of operations and goods movement, and enhance the safety and incident response capabilities throughout the port.
Ports are also looking at how to schedule the flow of dray haulers as to limit truck waiting times and the number of trucks that need to come into the port. “A significant part of local congestion is related to dray haulers waiting locally for many hours before being able to get access to the port,” says Chris Jones, executive vice president of industry and service at Descartes Datamyne.
Inland ports are increasingly being used to reduce dwell time and expedite shipments.
Last year the Port of Long Beach (POLB) partnered with the Utah Inland Port Authority to improve cargo flows between Southern California and Utah, Colorado, Nevada and Idaho. Here the POLB will invest $1 billion in rail improvements over the next 10 years, and the Utah Inland Port Authority will strengthen its ability to transfer cargo for further distribution.
South Carolina Ports Authority (SCPA) is moving cargo inland to its Inland Port Greer and Inland Port Dillon to meet up with rail services operated by Norfolk Southern and CSX, respectively.
To handle even more cargo, SCPA is expanding Inland Port Greer by building additional rail processing and storage tracks within the terminal, expanding its container yard, enlarging the existing chassis yard, and building new facilities for heavy lift maintenance and terminal operations.
Georgia Port Authority (GPA) is employing pop-up arrangements for the use of off-port acreage that includes a 330-acre CCX Yard in Rocky Mount, N.C., which is owned and operated by CSX Rail. GPA’s initial arrangement with CSX calls for the port authority to use 400 container slots at the facility for an annual capacity of 40,000 TEUs.

Article Topics
Ports News & Resources
U.S.-bound import growth track remains promising, notes Port Tracker report Q&A: Port of Oakland Maritime Director Bryan Brandes Signs of progress are being made towards moving cargo in and out of Baltimore New Breakthrough ‘State of Transportation’ report cites various challenges for shippers and carriers in 2024 Industry experts examine the impact of Baltimore bridge collapse on supply chains Port of Baltimore closed indefinitely to ships after 1.6-mile Key Bridge collapses following maritime accident February and year-to-date U.S. import growth is solid, reports S&P Global Market Intelligence More PortsLatest in Logistics
DAT March Truckload Volume Index sees modest March gains National diesel average, for week of April 22, is down for the second straight week UPS reports first quarter earnings declines LM Podcast Series: Assessing the freight transportation and logistics markets with Tom Nightingale, AFS Logistics Investor expectations continue to influence supply chain decision-making The Next Big Steps in Supply Chain Digitalization Warehouse/DC Automation & Technology: Time to gain a competitive advantage More LogisticsSubscribe to Logistics Management Magazine

Find out what the world's most innovative companies are doing to improve productivity in their plants and distribution centers.
Start your FREE subscription today.
April 2023 Logistics Management

Latest Resources


